25. Quiz: Shape and Outliers (Final Quiz)
Histograms
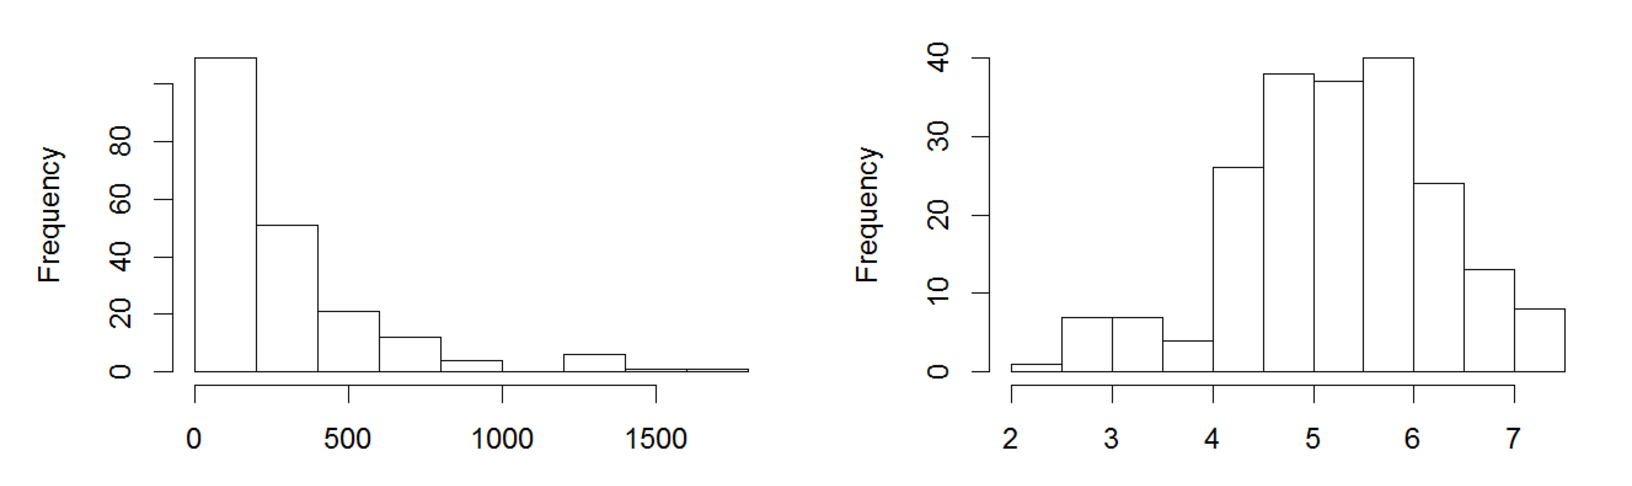
Let the histogram on the left be Histogram 1 and the histogram on the right be Histogram 2.
Quick Notes
Pay attention to the scale of these two graphs. The first is dealing with a lot higher numbers.
The median is the middle number and is not effected by outliers.
The average factors in all the number so outliers will bring the average towards them.
Left Skewed is when the graphs starts with a low frequency and then slopes up. Right Skewed is when the graph starts with a high frequency and slopes down.
Histogram Matching
QUIZ QUESTION::
Correctly match the histograms to the statements that are true about each.
ANSWER CHOICES:
|
Statement |
Histogram |
|---|---|
Mean is greater than the median. |
|
Data has higher variance. |
|
Binwidth is equal to 0.5. |
|
The range is approximately 5.5. |
|
Distribution is left-skewed. |
|
The mean is approximately equal to the median. |
SOLUTION:
|
Statement |
Histogram |
|---|---|
|
Distribution is left-skewed. |
|
|
Binwidth is equal to 0.5. |
|
|
The range is approximately 5.5. |
|
|
The mean is approximately equal to the median. |
|
|
Binwidth is equal to 0.5. |
|
|
The range is approximately 5.5. |
|
|
The mean is approximately equal to the median. |
|
|
Mean is greater than the median. |
|
|
Data has higher variance. |
|
|
Mean is greater than the median. |
|
|
Data has higher variance. |
|
|
Binwidth is equal to 0.5. |
|
|
The range is approximately 5.5. |
|
|
The mean is approximately equal to the median. |
|
|
Mean is greater than the median. |
|
|
Data has higher variance. |
|
|
Distribution is left-skewed. |
|
|
Binwidth is equal to 0.5. |
|
|
The range is approximately 5.5. |
|
|
The mean is approximately equal to the median. |